During Workplace Ninja US, I did an in-person session on this topic, and now I am releasing for all. I’ve built Azure Virtual Desktop environments in a few different ways over the years — quick POCs, “just one host pool” builds, and full-blown enterprise deployments. The problem is the same every time: it starts simple and then you end up stitching together monitoring, scaling plans, RBAC, dashboards, and cost alerts… usually across multiple Terraform folders.
So I pulled everything into one modular Terraform repo that can deploy four AVD patterns (pooled/personal + desktop/RemoteApp), with optional enterprise-grade monitoring, dashboards, cost management, and scaling.
It also follows Microsoft Cloud Adoption Framework (CAF) naming patterns for the main AVD + network resources (host pool, app group, workspace, vnet/subnet/nsg, etc.).
Why this repo is “enterprise ready”
A few highlights that make this more than a basic host pool deployment:
Scaling plans for pooled deployments (desktop + RemoteApp) and environment-specific schedules
Monitoring & observability using Log Analytics + diagnostics
Custom dashboards for operational visibility
Cost management with budgets + alerts
CAF-friendly naming so your portal stays clean and consistent
Supported deployment types (quick view)
The configuration automatically adjusts host pool/app group settings depending on deployment_type (pooled vs personal, desktop vs RemoteApp).
The deployment guide uses a Service Principal stored in a local .env file (ignored by git), and a set-auth.ps1 script that loads the values into ARM_* environment variables for Terraform.
High level flow: .env → set-auth.ps1 → ARM_* env vars → Terraform
Create your .env from .env.example, then run:
.\set-auth.ps1
Scaling plans note: your Service Principal needs the Desktop Virtualization Power On Off Contributor role at subscription scope for scaling to work properly.
Terraform init / plan / apply
terraform init
terraform plan -var-file=dev-pooled-desktop.tfvars
terraform apply -var-file=dev-pooled-desktop.tfvars
Monitoring, dashboards, cost alerts (optional but worth it)
If you use one of the monitoring/scaling-enabled tfvars options, the repo can deploy:
Log Analytics + diagnostics
Dashboards for ops visibility
Budgets/alerts for cost tracking
A quick note on dependency ordering (why it matters)
The repo is intentional about resource ordering — especially for scaling plans — to avoid portal oddities and ensure the host pool association is reliable. The dependency flow is documented and includes a separate scaling plan host pool association resource.
Resoure Group (RG)
Application Groups (AG)
Wrap up
If you want a repeatable way to deploy AVD that supports pooled + personal and desktop + RemoteApp, while also giving you the option to turn on monitoring, dashboards, budgets/alerts, and scaling, this repo is designed for exactly that.
If you’ve been running Azure Virtual Desktop for a while, you already know the pain: keeping session hosts consistent is easy until you start chasing app versions, Windows Updates, Teams changes, and the “one missing dependency” that breaks someone’s day.
Microsoft calls this a golden image approach: bake your base OS + apps + config once, then roll it out to session hosts consistently. (Microsoft Learn)
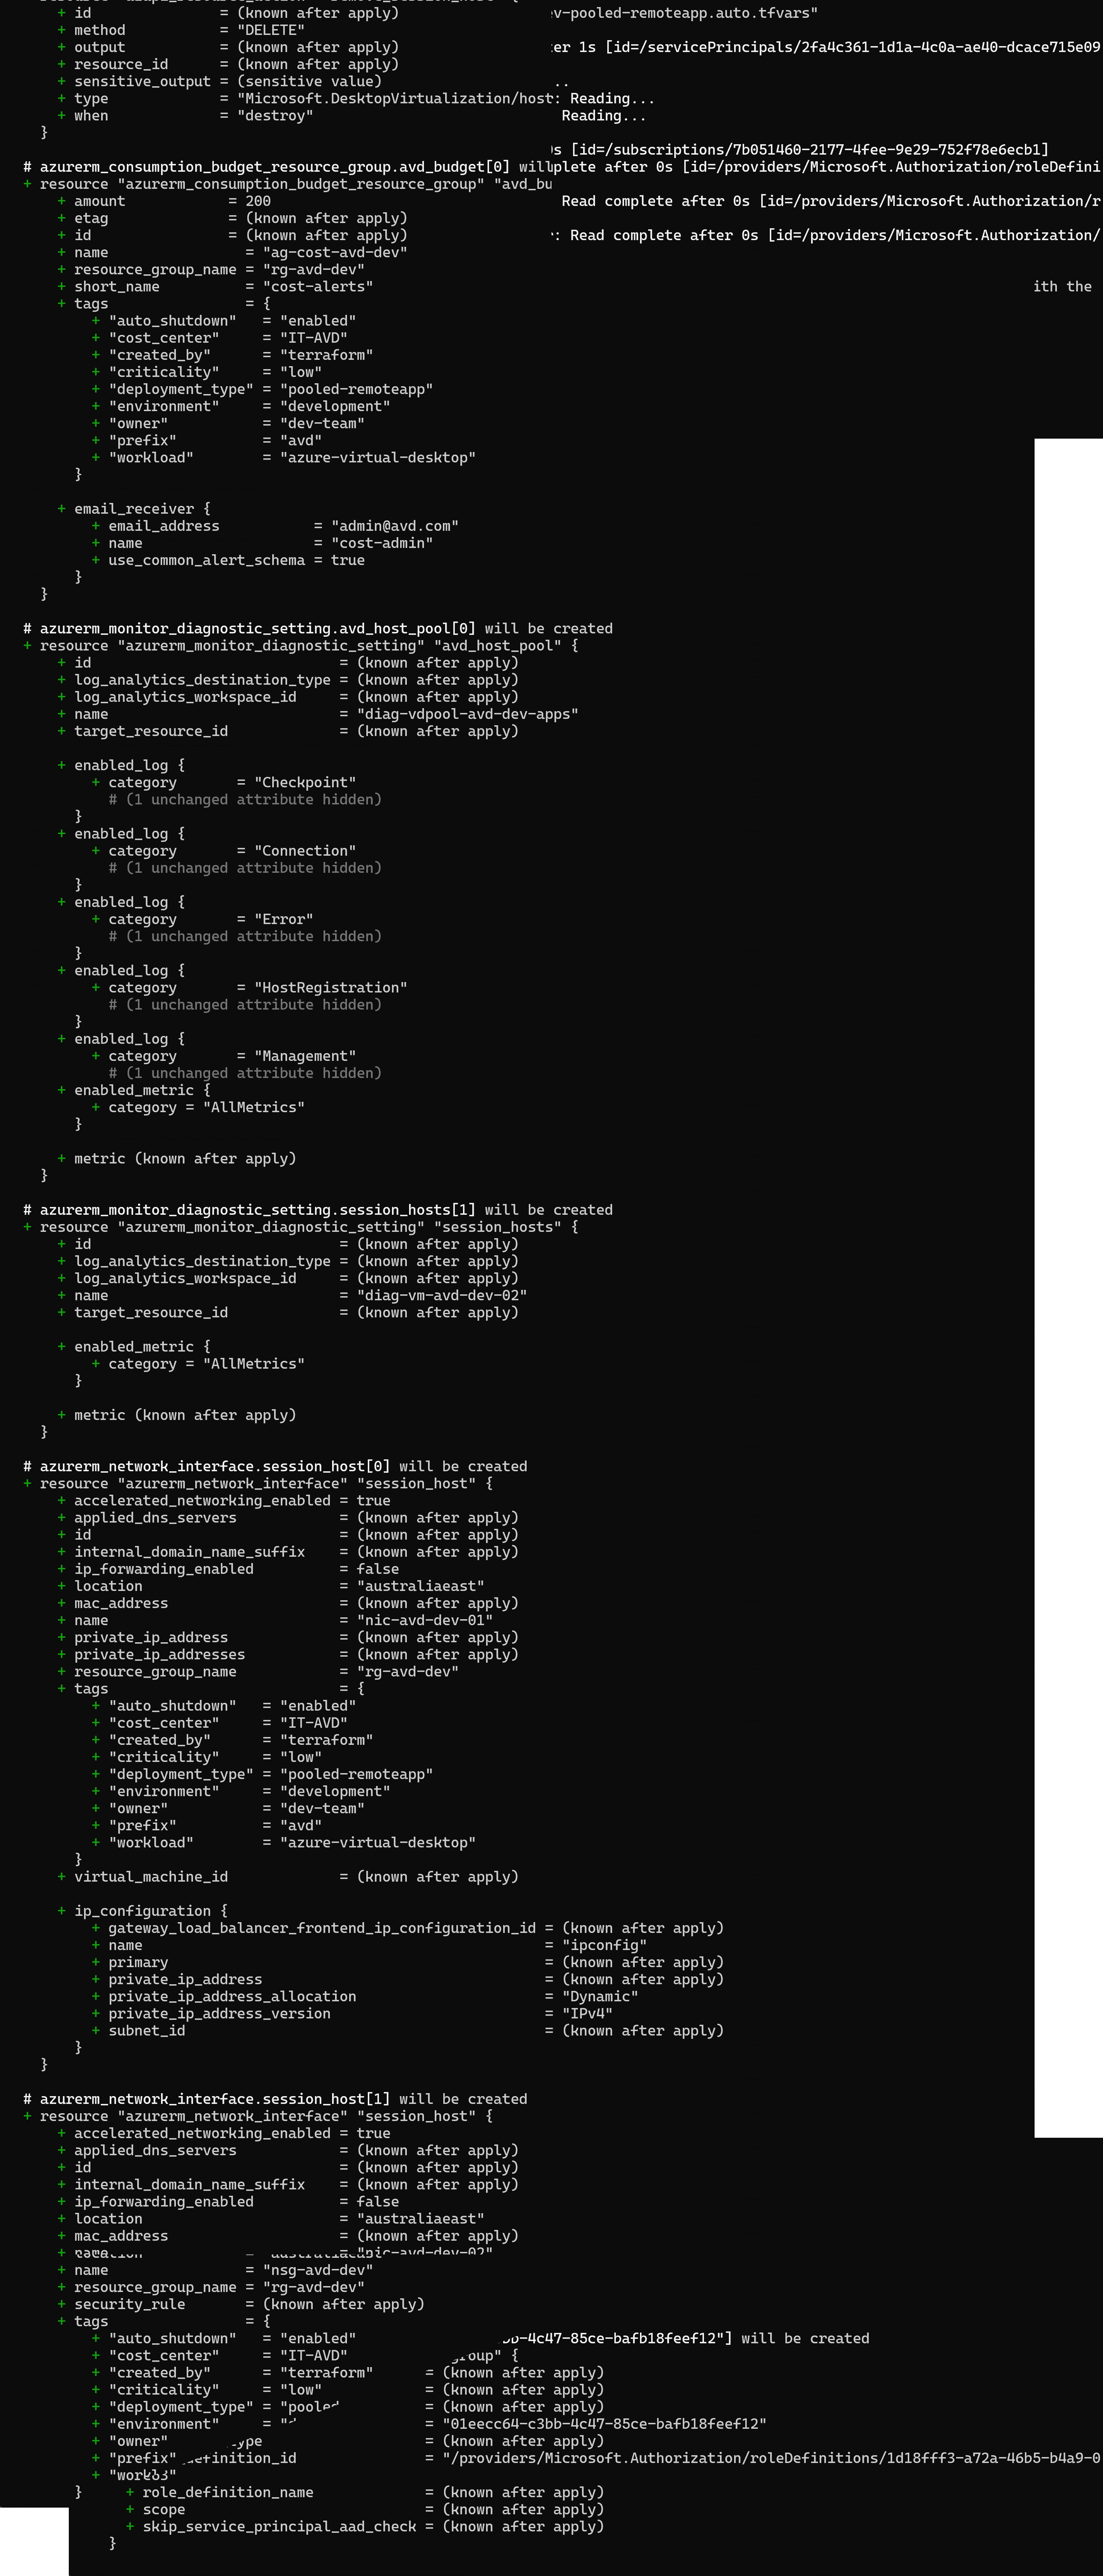
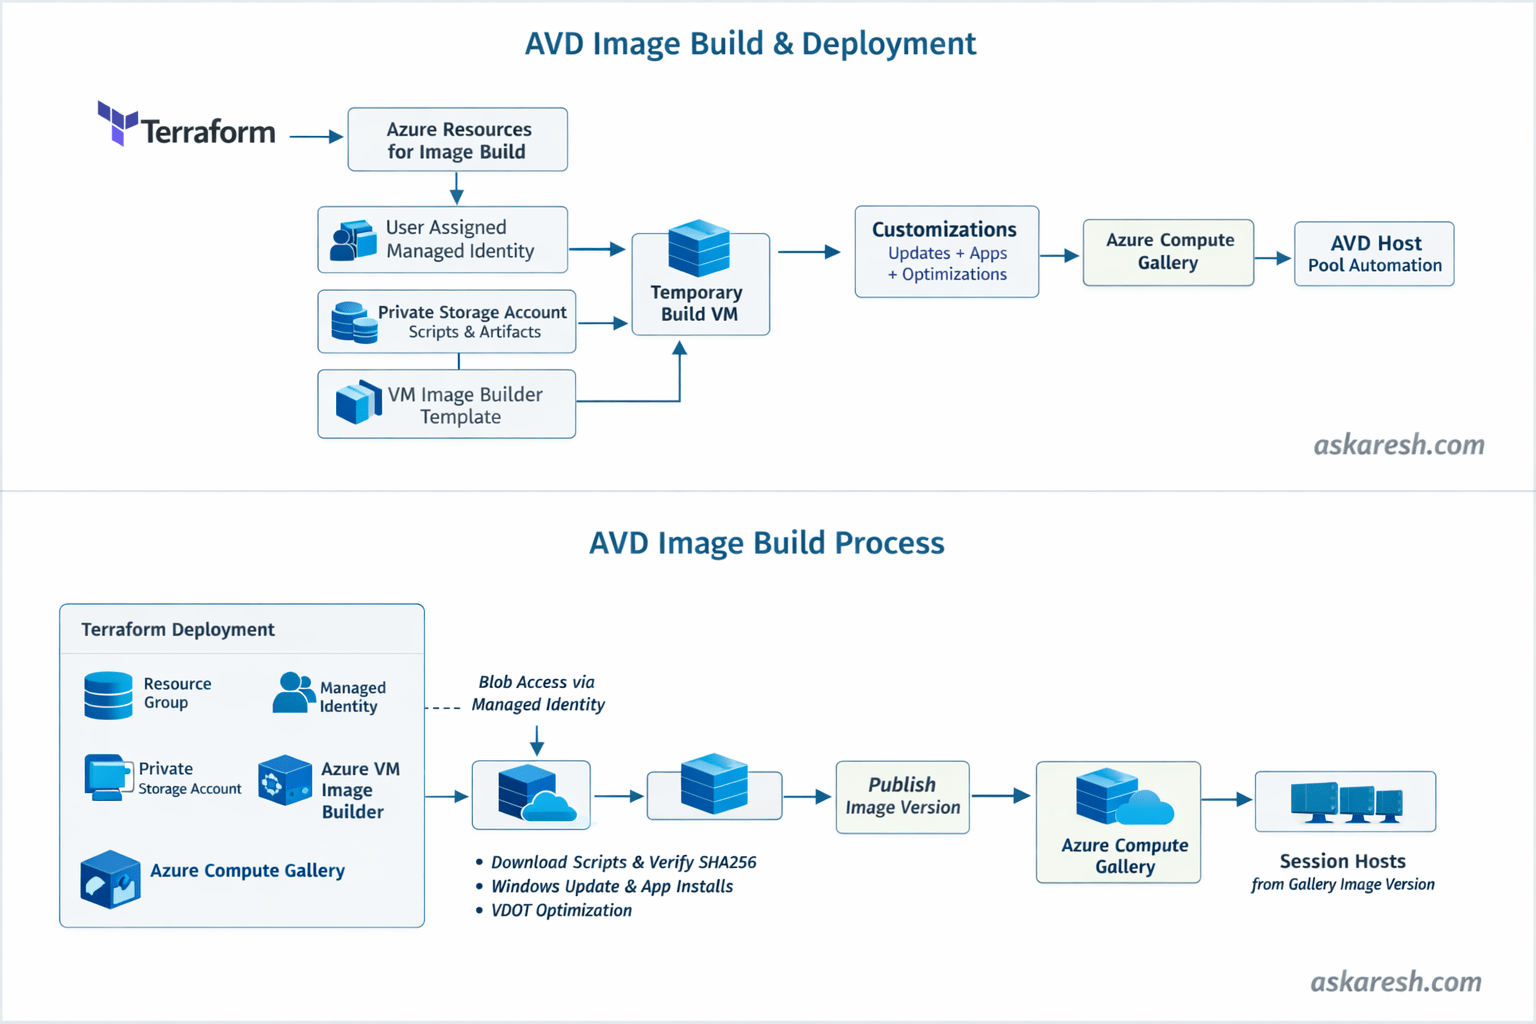
In this post, I’m sharing a Terraform-based approach that builds a custom AVD image using Azure VM Image Builder (AIB) and publishes it to Azure Compute Gallery (ACG) so you can consume it in your AVD host pool automation. (Microsoft Learn)
Terraform provisions the Image Builder “plumbing” (identity, storage, template, etc.)
Azure VM Image Builder spins up a temporary build VM
The build VM runs updates + optimizations + app installs (your choice)
The final image gets published into Azure Compute Gallery
You use that gallery image version when creating/re-imaging AVD session hosts (GitHub)
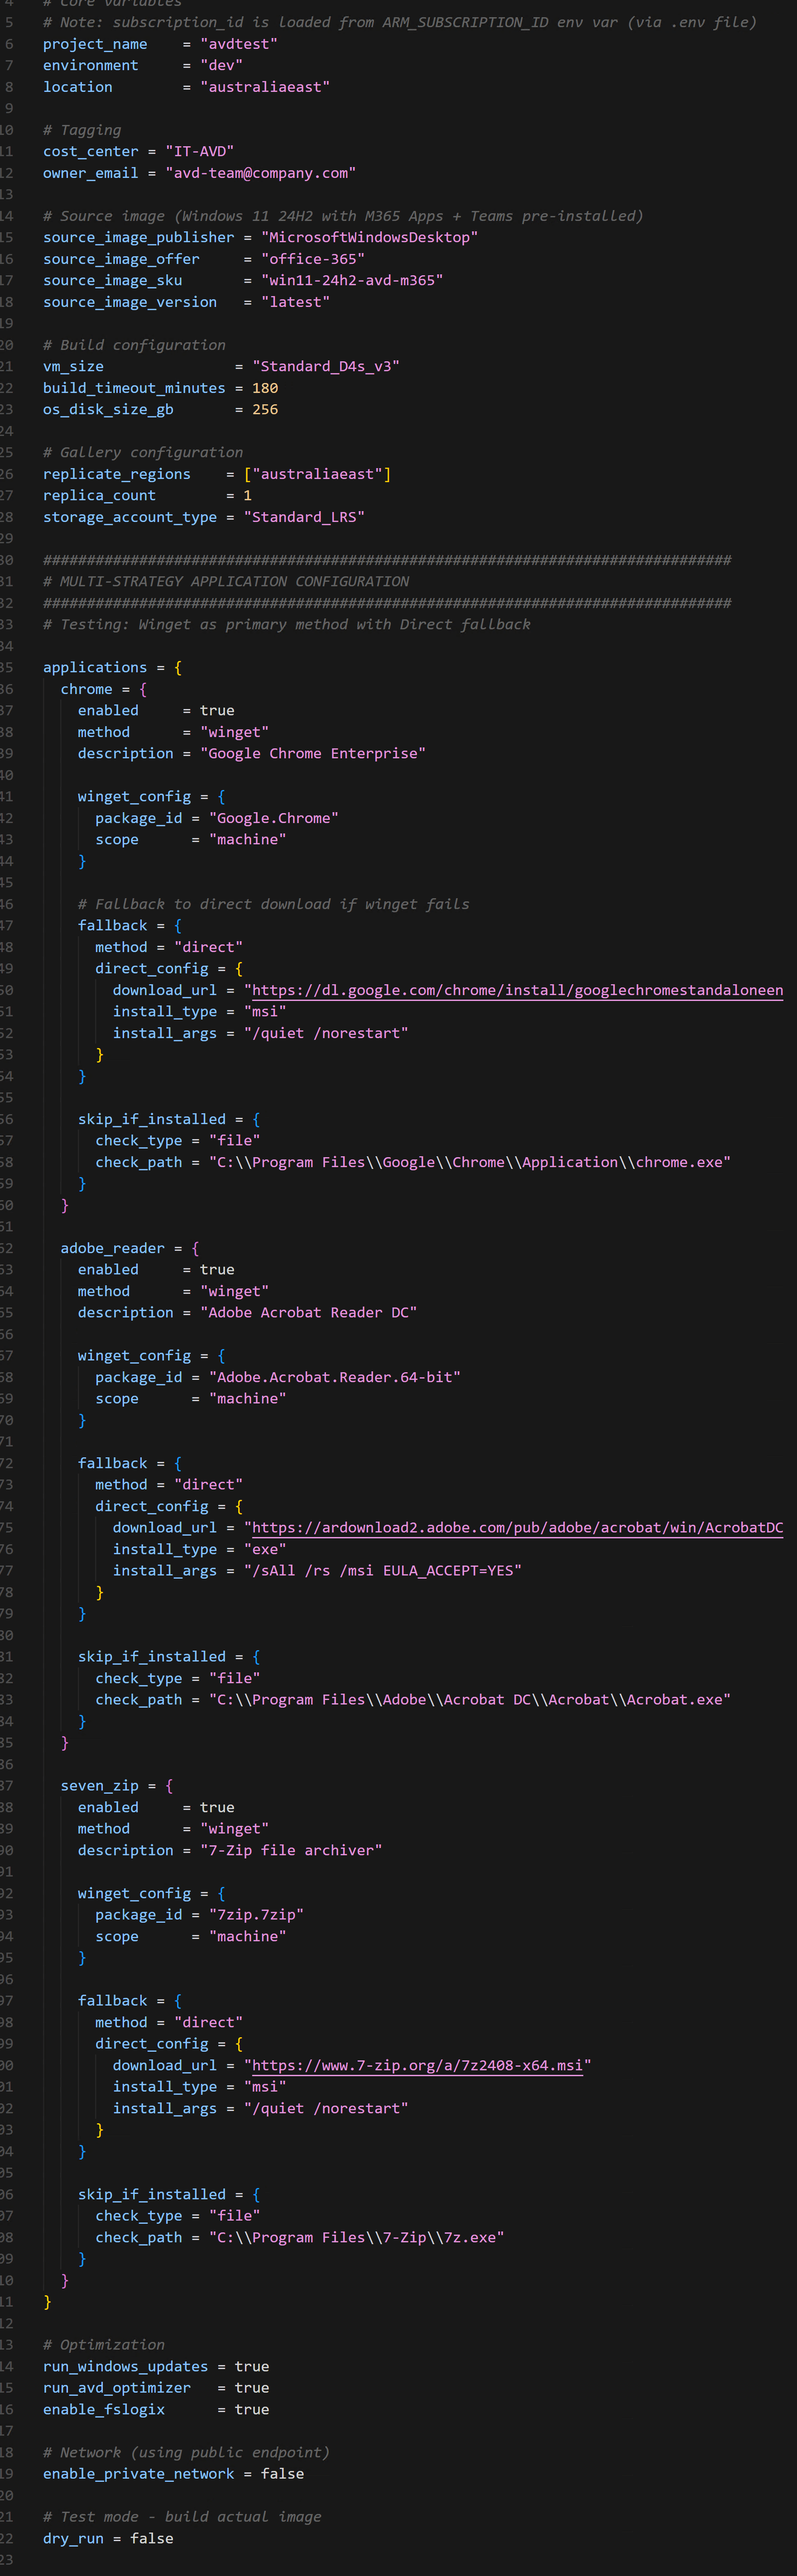
This repo uses a Windows 11 multi-session AVD + Microsoft 365 marketplace image as the starting point (so M365 and Teams are already there), then layers your customizations on top. (GitHub)
Why I like this approach
A few things in this repo are intentionally “enterprise friendly”:
No public script URLs / no long-lived SAS tokens: scripts are stored in a private blob container and downloaded using the Image Builder user-assigned managed identity. (GitHub)
SHA256 integrity checks: if someone tampers with your script artifacts, the build fails. (GitHub)
Deterministic image versioning: default version format is YYYY.MM.DD, with an option to override. (GitHub)
Optional optimization steps like Virtual Desktop Optimization Tool (VDOT) and FSLogix config (handy in AVD land). (GitHub)
Architecture
Pre-requisites
Azure subscription + permissions to create IAM assignments, storage, and image resources.
Terraform installed (repo expects Terraform + AzureRM provider versions aligned with the README). (GitHub)
Azure VM Image Builder basics: it supports starting from Marketplace/custom images and publishing to Azure Compute Gallery. (Microsoft Learn)
Start from the example and edit what you need (region, naming, feature toggles, etc.). (GitHub)
3. Authenticate
Use your preferred method (interactive az login locally, or service principal in CI/CD). The repo also calls out using .env locally and keeping secrets out of Git. (GitHub). The PowerShell script set-auth.ps1 calls these environment variables.
4. Terraform init / plan / apply
terraform init -upgrade
terraform plan -out image.tfplan
terraform apply image.tfplan
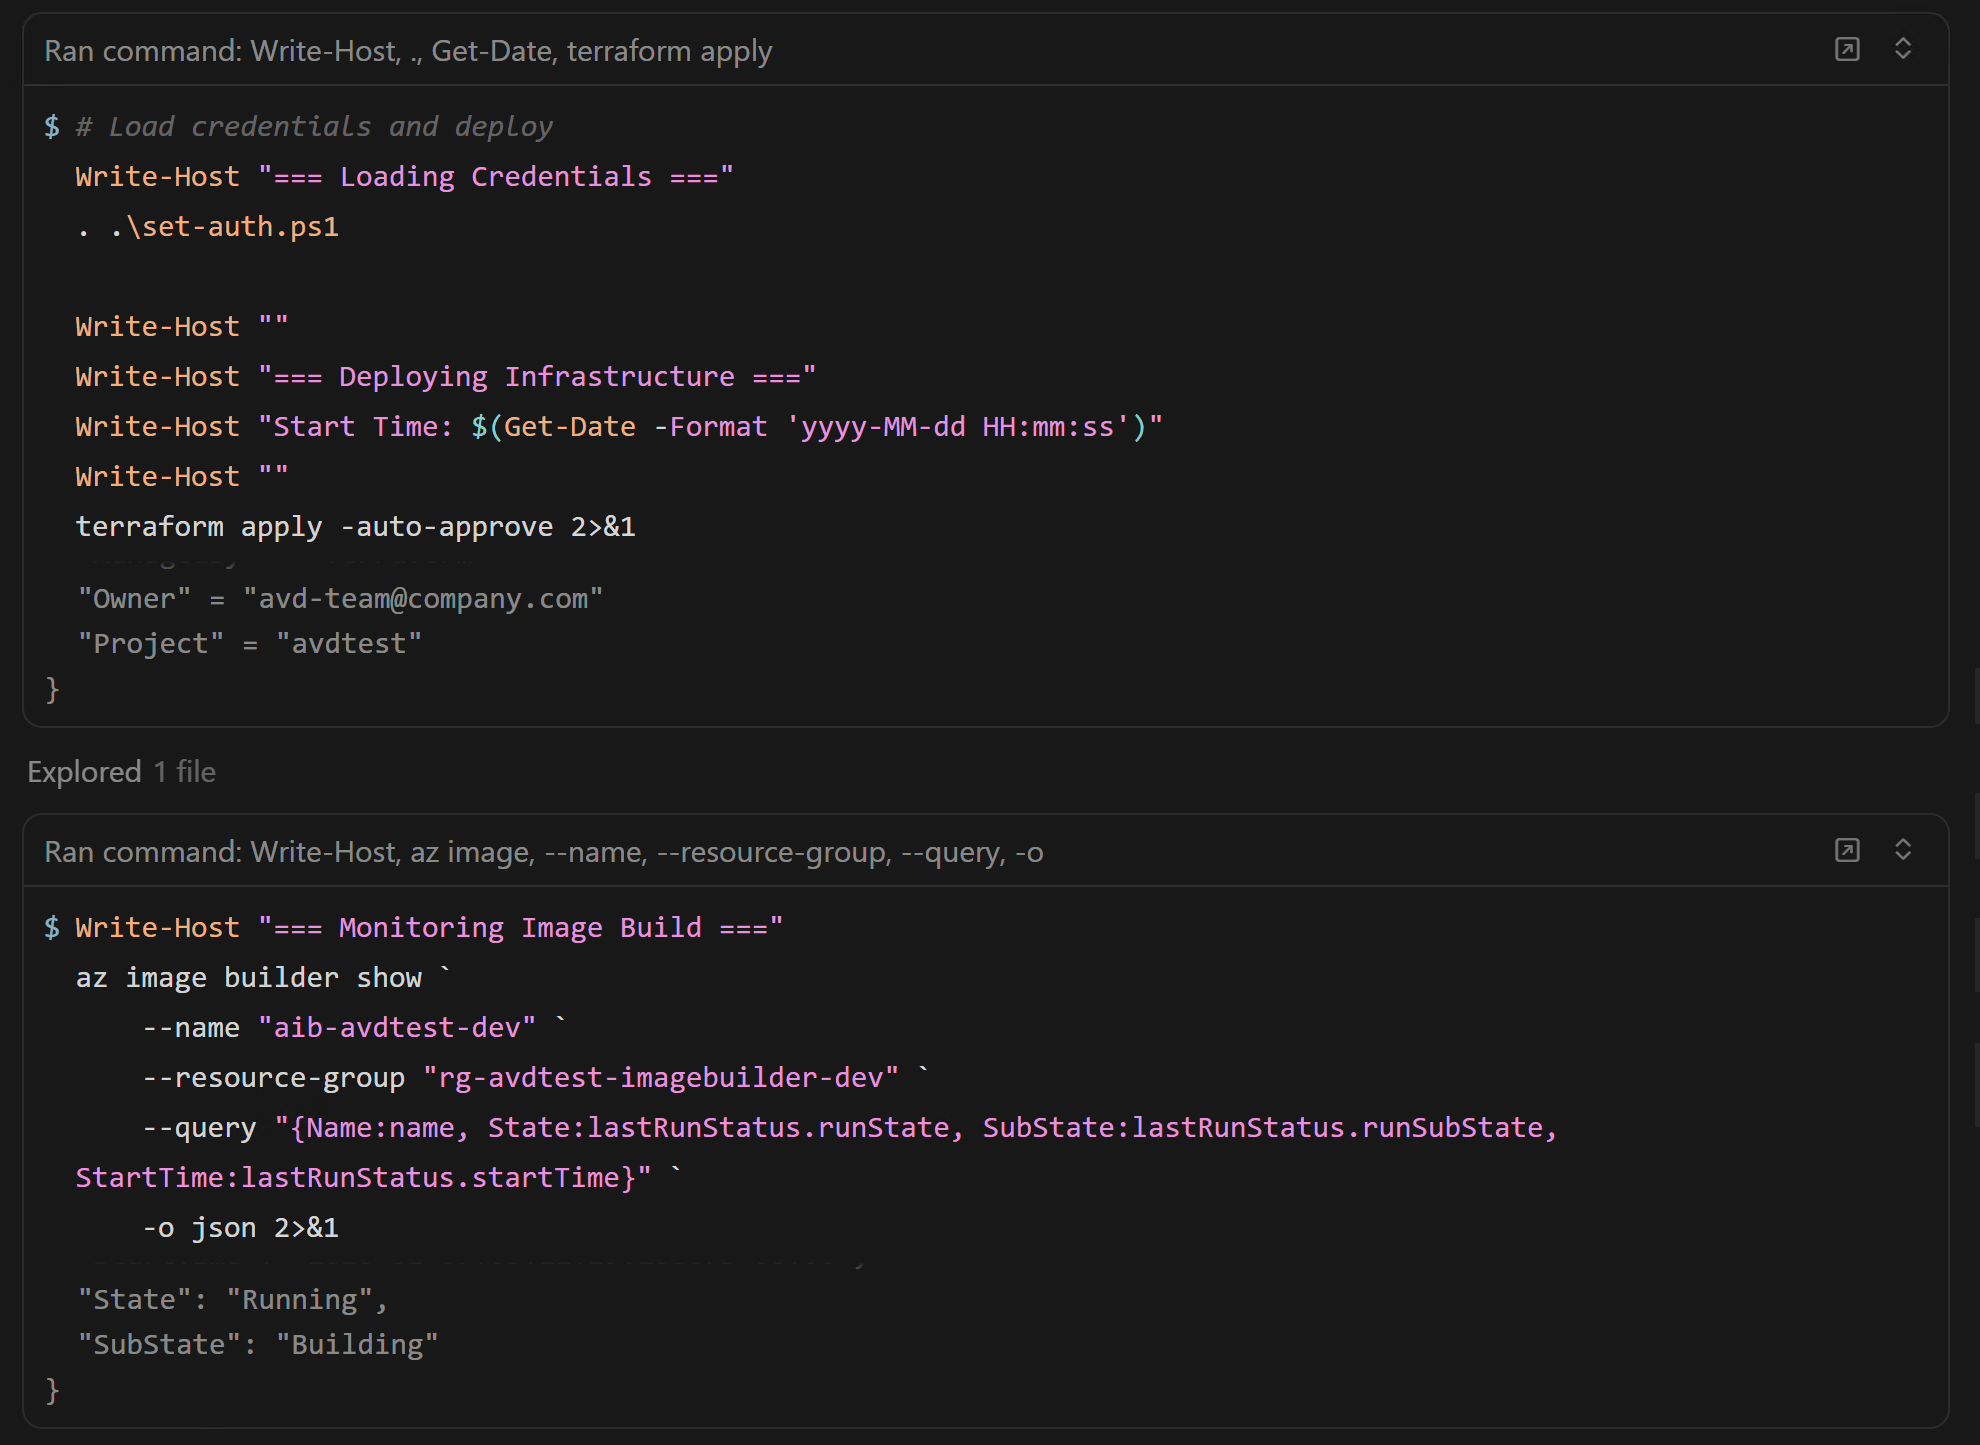
Important note: Terraform provisions the Image Builder template, but doesn’t wait for the build to finish. (GitHub)
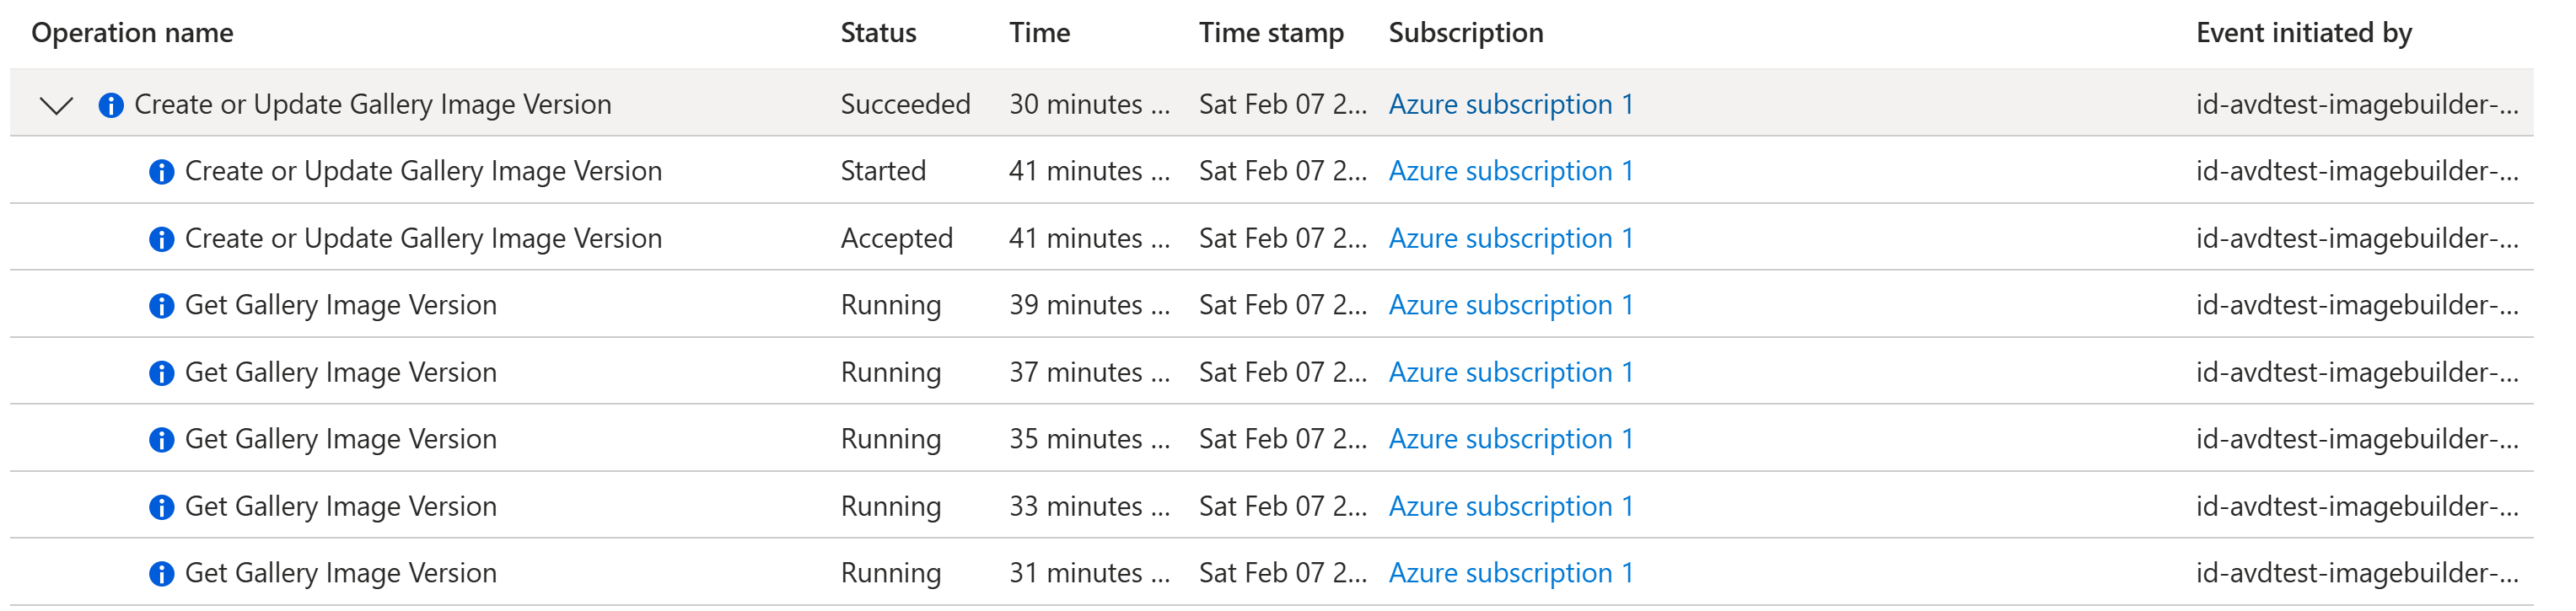
5. Trigger + monitor the image build
You can monitor runs in the portal, or with Azure CLI:
az image builder show-runs shows run outputs for the template. (Microsoft Learn)
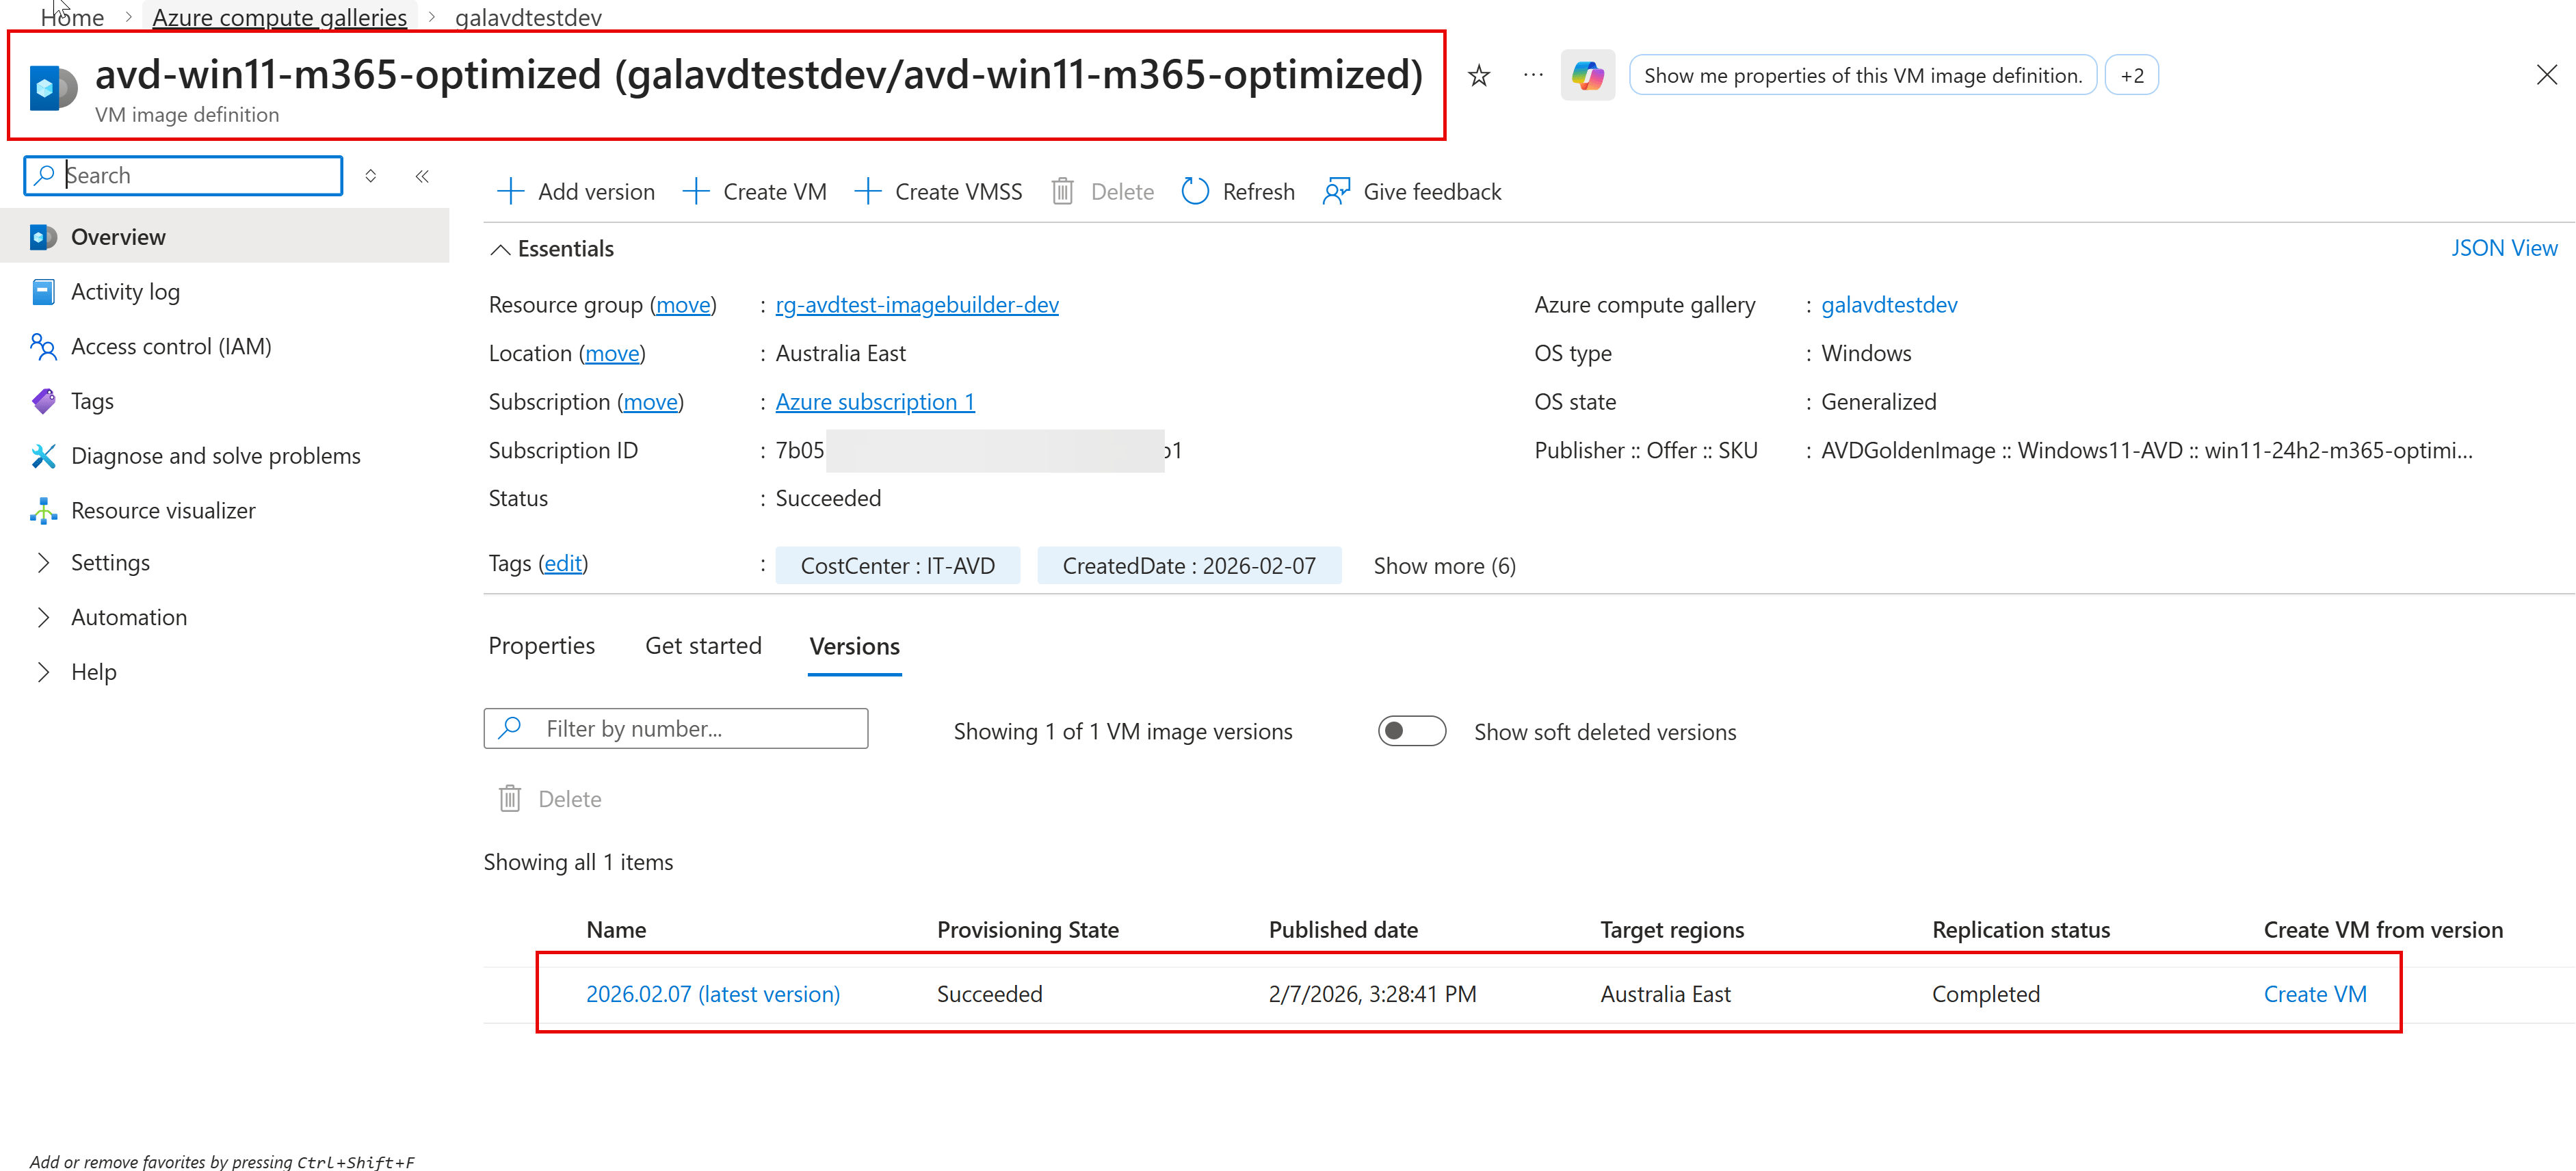
6. Validate the image in Azure Compute Gallery
Once the build completes, you’ll see a new image version in Azure Compute Gallery. ACG is designed to manage/share images and versions cleanly across environments. (Microsoft Learn)
Customizing applications (the fun part)
This repo supports multiple install strategies with fallback (so you’re not stuck when winget is blocked in some environments):
Build time: expect ~45–75 minutes depending on Windows Updates and app installs. (GitHub)
Template updates: Image Builder doesn’t really do “in-place template updates” the way you’d hope—plan on the “replace template” pattern when you change major parts. (Microsoft Learn)
Networking: if you go private networking / locked-down egress, make sure your update/app endpoints are reachable (or use offline packages). (GitHub)
AVD consumption: this pipeline publishes the image version—your AVD session host deployment should point to that exact gallery version. (GitHub)
Where this fits in your AVD build
If you already deploy host pools/workspaces/scaling plans via Terraform, think of this repo as the image factory that feeds your host pool automation. (Build image → publish to gallery → deploy session hosts from that version.) (GitHub)
Wrap up
That’s it — repeatable AVD image builds, versioned in Azure Compute Gallery, with a setup that avoids public script endpoints and keeps things predictable. (GitHub)
I hope you find this helpful information for building and maintaining an AVD golden image using Terraform + Azure VM Image Builder. If I have missed any steps or details, I will be happy to update the post.
If you manage Windows 365 Cloud PCs, there’s good news — Copilot in Intune now supports Windows 365, and it’s generally available! This new capability brings the power of AI directly into the Intune admin center, helping IT pros quickly understand, troubleshoot, and optimize their Cloud PC environments through natural-language conversations. Let’s break down what this means in simple terms — and how you can make the most of it.
Please note that when you enable Copilot in Intune, it will blow up your credits like no tomorrow. I exhausted $150 in under 24 hours. Please be careful when performing testing and validation.
What Is Copilot in Intune?
Think of Copilot in Intune as your AI-powered assistant/MCP/Agent inside the Intune portal. Instead of digging through dashboards or complex reports, you can simply type questions like:
“Show me my Enterprise Cloud PC licenses.”
“Analyze trends in bandwidth performance.”
“Summarize Cloud PCs that have never been used.”
Copilot then reads your organization’s Windows 365 data (based on your role and permissions) and returns insights — instantly.
It’s built to save IT admins time, surface actionable information, and make complex management tasks feel as easy as chatting with a colleague.
Getting Started: Enabling Copilot for Windows 365
Before using Copilot’s Windows 365 features, make sure Copilot in Microsoft Intune is enabled. Then, confirm that the Windows 365 plug-in is turned on in the Security Copilot portal:
In the prompt bar, click the Sources icon (you’ll see it on the right side).
In the Manage sources pane, toggle on Windows 365.
That’s it! Once connected, your Copilot chat experience in Intune will be able to access your organization’s Windows 365 data securely — respecting role-based access controls (RBAC) and scope tags.
What You Can Do with Copilot in Intune for Windows 365
This integration is designed to give IT professionals faster insight into four key areas:
1. Cloud PC Performance Optimization
Copilot analyzes performance data and highlights Cloud PCs that may need resizing — whether they’re overpowered (wasting cost) or under-spec’d (affecting user experience). It even suggests configuration changes and provides trend analysis so you can act proactively.
2. User Experience Insights
Having connection issues? Ask Copilot to identify regions or user groups experiencing latency, bandwidth drops, or connection instability. It can summarize performance trends and pinpoint whether problems are widespread or isolated — perfect for diagnosing issues before they escalate.
3. License and Cost Optimization
Licenses aren’t cheap — and unused Cloud PCs can quietly eat into budgets. Copilot identifies underutilized or inactive Cloud PCs, helping you reallocate licenses efficiently. You’ll get summaries of usage patterns, device age, and connection history — all within your chat results.
4. Cloud PC Management Assistance
Need to troubleshoot provisioning or grace-period issues? Copilot automatically scans for common causes, provides diagnostic context (like provisioning errors or expiration dates), and links directly to remediation resources. You can even analyze up to 10 Cloud PCs in bulk, saving hours of manual work.
Real-World Prompts You Can Try
Here are some examples you can copy directly into your Copilot chat:
Category
Example Prompts
Availability
“Analyze unavailable Cloud PCs” “Summarize Cloud PCs that cannot connect by region”
Connection Quality
“Show regions with increasing Cloud PC latency” “Show Cloud PCs experiencing low bandwidth”
Licensing
“Summarize my Cloud PC license inventory” “Show me my Frontline Cloud PC licenses”
Utilization
“Summarize Cloud PCs that have never been used” “Show Cloud PCs that are underutilized”
Performance
“Summarize performance of my Cloud PCs” “Show me Cloud PCs that are candidates for downgrading”
Each query runs in the context of your organization’s Windows 365 data — giving results that are accurate, relevant, and scoped to your permissions.
I could have shown you many more examples – I ran out of credits 🙂
Why It Matters
With Copilot in Intune for Windows 365, IT admins can move from reactive monitoring to proactive management. Instead of sifting through logs or building reports, you can simply ask Copilot — and act on data-driven insights right away.
This not only boosts efficiency but also helps improve end-user experience, optimize license usage, and strengthen overall cloud resource management.
Business standpoint – You don’t need highly skilled resources to skim through the logs, various dashboards and widgets to get a better understanding. Anyone who can ask the questions should be able to retrieve the information.
Final Thoughts
Microsoft’s vision for AI-assisted IT administration is becoming clearer — and Copilot in Intune for Windows 365 is a perfect example of that. It’s not just a fancy chatbot; it’s a practical, data-driven assistant that brings clarity, automation, and intelligence to everyday Cloud PC management.
If you’re an IT admin managing Windows 365, now’s the time to try it out. Head over to the Intune admin center, enable Copilot, and start asking questions — your Cloud PCs will thank you!
I hope this information helps you enable Copilot for W365. If I have missed any steps or details, I will be happy to update the post.
In Part 1 we built the provisioning policy and wired it to a group with size/capacity. In Part 2, we’ll actually publish the apps, tweak their details, undo changes when needed, and explain how licensing & concurrency work (with a simple diagram).
Once your first Frontline Cloud PC (Shared mode) finishes provisioning, the image’s Start-menu apps appear in Windows 365 → All Cloud Apps as Ready to publish.
You can:Publish, Edit, Reset, and Unpublish apps here. Deletion is tied to the policy assignment (more on that below).
Publish an app (All Cloud Apps)
Intune Admin Center → Devices → Windows 365 → All Cloud Apps
Pick one or more apps (Word, Excel, PowerPoint and Edge) with status Ready to publish → Publish
Watch the status flow:
Ready to publish → Publishing → Published
Once Published, the app appears in Windows App for all users assigned to the provisioning policy.
All Cloud Apps list (Ready → Publishing → Published)
If an app shows Failed: Unpublish it, then publish again. Check that the Start-menu shortcut on your image is valid (path/command still exists).
Edit an app (safe, instant updates)
For a published or ready app, select Edit to adjust:
Display name
Description
Command line (e.g., parameters)
Icon path index
Changes inherit scope tags & assignment from the provisioning policy, and updates are immediate in Windows App.
Edit dialog (name/description/command/icon index)
Reset an app (rollback to discovered state)
If you went too far with edits, use Reset to revert back to whatever was discovered from the image originally (name/icon/command). Great for quick experiments.
Reset confirmation
Unpublish (and how “delete” works)
Unpublish: App status goes Published → Ready to publish and the app disappears from Windows App. Its edited details are reset.
Delete: There isn’t a “delete app” button—Cloud Apps are discovered from the image. To truly remove an app from scope, remove the provisioning policy’s assignment (or update the image so the Start-menu shortcut no longer exists).
Unpublish action
Accessing apps (Windows App)
Users launch Windows App (Windows/macOS/iOS/Android) and see the Published apps. Selecting an app starts a session on a Frontline Cloud PC (Shared mode).
A published app can spawn other apps on that Cloud PC when needed (e.g., Outlook opening Edge from a link), even if the other app isn’t separately published.
To tightly control what can launch, use Application Control for Windows policies.
Frontline (Shared mode) is built for brief, task-oriented access with no data persistence per user session. Think “one at a time” use of a shared Cloud PC.
The rules!
1 Frontline license = 1 concurrent session.
You can assign many users to the policy, but only N can be active at once (where N = number of Frontline licenses you assigned to that policy).
When a user signs out, their data is deleted and the Cloud PC is free for the next user.
There’s no concurrency buffer for Frontline Shared mode (and none for GPU-enabled Cloud PCs).
Monitoring concurrency (what to look at)
Frontline connection hourly report: See active usage over time; verify you’re not hitting limits.
Frontline concurrency alert: Get notified if you breach your concurrency threshold.
Note: Concurrency buffer doesn’t apply to GPU or Frontline Shared Cloud PCs—plan capacity accordingly.
Practical sizing tip: Start with a license count that matches your peak simultaneous users for that group/policy. Watch the hourly report for a week, then adjust up/down.
Troubleshooting checklist
Published but not visible? Confirm the user is in the assigned group and is using the latest Windows App.
Failed on publish? Unpublish → Publish. Validate the Start-menu shortcut on the image and any custom command-line parameters.
Unexpected app launches (e.g., Edge opens)? That’s normal when an app calls another binary. Use Application Control if you must restrict it.
Hitting concurrency: Users 1..N can connect; N+1 waits. Increase Frontline licenses on the policy or split users into multiple policies sized per peak.
I hope you find this helpful information for creating a Cloud App. If I have missed any steps or details, I will be happy to update the post.
This is part one of a two-part series on Windows 365 Cloud Apps. In this post, we’ll walk through what Cloud Apps are and how to create the provisioning policy with PowerShell. In part two, we’ll publish the apps themselves. I’ll also include the PowerShell script that uses Azure/Graph REST APIs.
What is Windows 365 Cloud Apps?
Windows 365 Cloud Apps let you give users access to specific apps streamed from a Cloud PC—without handing out a full desktop to everyone. Under the hood, Cloud Apps run on Windows 365 Frontline Cloud PCs in Shared mode. That licensing model is designed for shift or part-time staff: many users can be assigned, but only one active session per license at a time.
Think of it as “just-the-apps” VDI: Outlook, Word, your line-of-business app—delivered from the cloud—with the management simplicity of Windows 365 and Intune.
Why customers care: You streamline app delivery, lower overhead, and modernize VDI without building and babysitting a big remote desktop estate.
Cloud Apps vs AVD Published Apps vs “Traditional” VDI Published Apps
Topic
Windows 365 Cloud Apps
Azure Virtual Desktop Published Apps
Traditional VDI Published Apps
What users see
Individual apps streamed from a Cloud PC; no full desktop
Individual apps from session hosts in Azure Virtual Desktop
Individual apps from on-prem or hosted RDS/Horizon/Citrix farms
Infra you manage
Cloud PC lifecycle via Intune; Microsoft operates the fabric
You design & operate host pools, scaling, FSLogix, images
You run the farm: brokers, gateways, hypervisors, storage
Licensing / sessions
Frontline: many users per license, 1 active session per license
Per-user/per-device or CALs + Azure consumption; multiple sessions per host
Per-user/device + on-prem infra costs
Admin plane
Intune + Windows 365
Azure Portal + ARM + Host pool automation
Vendor consoles + on-prem change management
App packaging
Start-menu discovered apps from the image (MSIX/Appx discovery expanding)
Image: Set $ImageType (e.g., "gallery") and $ImageId for your chosen image.
Region: $RegionName (e.g., australiaeast or "automatic").
Assignment:
$GroupId: Entra group whose members should see the Cloud Apps.
$ServicePlanId: the Frontline size (e.g., FL 2vCPU/8GB/128GB in the example).
$AllotmentCount: how many concurrent sessions you want available for this policy.
$AllotmentDisplayName: a friendly label that shows up with the assignment.
Verification/Polling: The script dumps the policy with assignments and can optionally poll for provisioned Cloud PCs tied to the policy.
Get-or-Create a Cloud Apps provisioning policy (userExperienceType = cloudApp, provisioningType = sharedByEntraGroup, Azure AD Join in a specified region).
Assigns the policy to an Entra group with service plan, capacity (allotment), and a friendly label
App discovery: Ensure the app has a Start menu shortcut on the image. That’s how Cloud Apps gets its list.
Security baselines: If your tenant enforces restrictions on PowerShell in the image at discovery time, discovery can fail.
MSIX/Appx: Discovery is expanding—classic installers show up first; some Appx/MSIX apps (e.g., newer Teams) may not appear yet.
Concurrency math: Active sessions for the policy are capped by assigned Frontline license count on that policy.
Schema drift: These are beta endpoints. If you hit a property/enum change, the script’s warnings will surface the response body—update the field names accordingly.
What’s next (Part 2)
We’ll move to All Cloud Apps to publish the discovered apps, tweak display name/description/command line/icon index, confirm they appear in Windows App, and cover unpublish/reset workflows—with your screenshots.
I hope you find this helpful information for creating a Cloud App using PowerShell. If I have missed any steps or details, I will be happy to update the post.
Today I’m diving into a feature that’s currently in preview but promises to be super useful for Windows 365 Cloud PC admins: Cloud PC Maintenance Windows.
If you’ve ever needed to resize multiple Cloud PCs but worried about disrupting users during work hours, this new feature is about to make your life much easier. Let’s break it down!
What Are Cloud PC Maintenance Windows?
Simply put, maintenance windows allow you to schedule when certain actions (currently just resize operations) will take place on your Cloud PCs. Instead of changes occurring immediately after you initiate them, you can schedule them to run during specified time periods.
Think of it as telling your Cloud PCs, “Hey, only accept these maintenance actions during these specific hours.” It’s perfect for organizations that need to plan around busy periods and minimize disruption.
Why You Should Care About This Feature
There are several compelling reasons to start using maintenance windows:
After-hours maintenance: Schedule resize operations to happen overnight or on weekends
Predictable changes: Users receive notifications before maintenance begins
Bulk operations: Apply resize actions to entire departments or teams at once
Organizational compliance: Meet any requirements about when system changes can occur
Setting Up Your First Maintenance Window
The setup process is straightforward and consists of two main parts: creating the window itself and then applying it to a device action.
Part 1: Creating a Maintenance Window
Sign into the Microsoft Intune admin center
Navigate to Tenant administration > Cloud PC maintenance windows (preview)
Click Create
On the Basics page:
Enter a descriptive Name (e.g., “Weekend Resize Window”)
Add a Description to help other admins understand the purpose
On the Configuration page:
Set your Weekday schedule (if applicable)
Set your Weekend schedule (if applicable)
Remember: Each window must be at least two hours long
Select when users will receive notifications (15 minutes to 24 hours in advance)
On the Assignments page:
Add the groups whose Cloud PCs will use this maintenance window
Review your settings and click Create
Part 2: Using Your Maintenance Window
Once your window is created, it won’t do anything by itself until you create a bulk device action that uses it:
In the Intune admin center, go to Devices > Windows Devices > Bulk device actions
For the configuration:
OS: Windows
Device type: Cloud PCs
Device action: Resize
Select your source and target sizes
Important: Check the box for Use Cloud PC maintenance windows
Add the devices/groups and create the action
When the maintenance window becomes active, the resize operation will run, and users will receive notifications based on the lead time you specified.
Powershell way to implement Cloud PC maintence
Step 1 – Install the MS Graph Beta Powershell Module
#Install Microsoft Graph Beta Module
PS C:WINDOWSsystem32> Install-Module Microsoft.Graph.Beta
Step 2 – Connect to scopes and specify which API you wish to authenticate to. If you are only doing read-only operations, I suggest you connect to “CloudPC.Read.All” in our case, we are creating the policy, so we need to change the scope to “CloudPC.ReadWrite.All”
#Read-only
PS C:WINDOWSsystem32> Connect-MgGraph -Scopes "CloudPC.Read.All" -NoWelcome
Welcome To Microsoft Graph!

OR

#Read-Write
PS C:WINDOWSsystem32> Connect-MgGraph -Scopes "CloudPC.ReadWrite.All" -NoWelcome
Welcome To Microsoft Graph!
Permissions for MS Graph API
Step 3 – Check the User account by running the following beta command.
displayname – Name of the policy “CloudPC-Window-askaresh”
Description – Enter details to remember for the future
notification – 60 min (tweak based on your company policies)
Schedule – Weekday (Ensure don’t enter business hours)
# Ensure the Microsoft.Graph.Beta module is installed
if (-not (Get-Module -ListAvailable -Name Microsoft.Graph.Beta)) {
    Write-Host "Installing Microsoft.Graph.Beta module..." -ForegroundColor Cyan
    Install-Module Microsoft.Graph.Beta -Force -AllowClobber
}
Import-Module Microsoft.Graph.Beta

# Connect to Microsoft Graph with the required permissions for maintenance operations
Write-Host "Connecting to Microsoft Graph..." -ForegroundColor Cyan
Connect-MgGraph -Scopes "CloudPC.ReadWrite.All" -NoWelcome

# Define the endpoint for Cloud PC maintenance windows
$uri = "beta/deviceManagement/virtualEndpoint/maintenanceWindows"

# Construct the JSON payload for the maintenance window
$maintenancePayload = @{
    displayName                   = "CloudPC-Window-askaresh"
    description                   = "A window for test"
    notificationLeadTimeInMinutes = 60
    schedules                     = @(
        @{
            scheduleType = "weekday"
            startTime    = "01:00:00.0000000"
            endTime      = "04:00:00.0000000"
        },
        @{
            scheduleType = "weekend"
            startTime    = "01:00:00.0000000"
            endTime      = "04:00:00.0000000"
        }
    )
} | ConvertTo-Json -Depth 5

# Call the Microsoft Graph API to create the maintenance window
try {
    Write-Host "Creating Cloud PC maintenance window..." -ForegroundColor Cyan
    $result = Invoke-MgGraphRequest -Method POST -Uri $uri -Body $maintenancePayload
    Write-Host "Maintenance window created successfully." -ForegroundColor Green
    $result | Format-List
}
catch {
    Write-Error "Error creating maintenance window: $_"
}

# Optionally disconnect from Microsoft Graph when done
Disconnect-MgGraph
The User Experience
From the user perspective, they’ll receive a notification in their Cloud PC session when a maintenance window is approaching. The notification will indicate that maintenance is scheduled and when it will occur. They can’t override or postpone the maintenance, but at least they’ll be prepared.
Current Limitations
It’s worth noting that this feature is still in preview, and has some limitations:
Currently only supports resize operations (likely to expand in the future)
The maintenance window itself doesn’t guarantee the success of operations
Doesn’t handle Windows updates, Intune payloads, or OS updates
Each window must be at least two hours long
When NOT to Use Maintenance Windows
If you have an urgent situation requiring immediate resizing of Cloud PCs, simply don’t check the “Use Cloud PC maintenance windows” box when creating your bulk action. This way, the resize will happen immediately rather than waiting for the next scheduled window.
Conclusion
Having played with this feature for a bit, I’m impressed with how it streamlines the management of Cloud PCs. Before this, scheduling maintenance was much more manual and potentially disruptive. While I wish it supported more actions beyond just resizing, this is a solid foundation that I expect Microsoft will build upon.
This feature is particularly valuable for organizations with users across different time zones or with strict requirements about when system changes can occur. It’s also a huge time-saver for admins who manage large fleets of Cloud PCs. I hope you find this helpful information for creating a Cloud PC maintenance window using PowerShell. If I have missed any steps or details, I will be happy to update the post.
Example – With Windows 365 Frontline Shared licensing, you don’t assign a license to each individual user. Instead, you provision a pool of shared virtual desktops and grant access to a designated group of users. Each shared license represents a virtual desktop that can be dynamically used by any authorized user when available. For example, rather than needing a strict 1:1 (or even 1:3) mapping between users and desktops, you can support many more employees than the number of desktops you provision—much like a traditional non-persistent VDI setup. Once a user logs off, their desktop resets and becomes available for another user, allowing you to meet peak concurrency needs without assigning a dedicated device to every single employee.
Connect to MS Graph API
Step 1 – Install the MS Graph Beta Powershell Module
#Install Microsoft Graph Beta Module
PS C:WINDOWSsystem32> Install-Module Microsoft.Graph.Beta
Step 2 – Connect to scopes and specify which API you wish to authenticate to. If you are only doing read-only operations, I suggest you connect to “CloudPC.Read.All” in our case, we are creating the policy, so we need to change the scope to “CloudPC.ReadWrite.All”
#Read-only
PS C:WINDOWSsystem32> Connect-MgGraph -Scopes "CloudPC.Read.All" -NoWelcome
Welcome To Microsoft Graph!

OR

#Read-Write
PS C:WINDOWSsystem32> Connect-MgGraph -Scopes "CloudPC.ReadWrite.All" -NoWelcome
Welcome To Microsoft Graph!
Permissions for MS Graph API
Step 3 – Check the User account by running the following beta command.
If you are doing on-premise network integration (Azure Network Connection) , then the following additional property and value is required. In my lab, I am leveraging the Microsoft Managed Network, so this is not required.
Additionally, if you have enrolled into autopatch the following is the parameter. You will have to put the name from the Intune Portal.
"autopatch": null,
I hope you will find this helpful information for creating a shared frontline worker provisioning policy using PowerShell. Please let me know if I have missed any steps or details, and I will be happy to update the post.
In this blog post, we’ll dive into how I built an offline comprehensive audio transcription and summarization system using OpenAI Whisper (medium) for transcription, a Microsoft Phi 3.5 Large Language Model (LLM) for summarizing, FastAPI for the REST API, and Docker for containerization. Audio content can be dense and long, so having an automated way to extract transcripts and high-level summaries can be a game-changer for meetings, interviews, podcasts, and beyond!
Traditional speech-to-text solutions focus on generating transcripts. However, reading pages of raw transcript text can be time-consuming. Conversational text is quite boring and often makes sense during an audio call by bringing an LLM-based summarizer into the pipeline changes the entire perspective:
High-Level Summaries: Quickly get the core ideas or key actions from a meeting.
Contextual Understanding: LLMs handle nuance like speaker changes, main topics, and action items.
Reduced Human Effort: Saves time sifting through entire transcripts.
High-Level Architecture
Audio Ingestion: The user uploads an audio file (e.g., .mp3, .wav).
Transcription: OpenAI Whisper medium model transcribes the audio into text.
LLM Summarization: A large language model (e.g., Microsoft Phi 3.5) processes the transcript and produces a condensed summary.
RESTful API: Built with FastAPI, handling file uploads and returning structured JSON responses.
Docker: Containerizes the entire application for easy deployment anywhere with a GPU.
Design Decisions
Following is the list of design decisions around this project:
Offline Processing – All processing is conducted locally to maximize efficiency. Utilizing a robust setup with multiple GPUs, specifically the cutting-edge NVIDIA graphics cards (A4000 and RTX 3090), ensures unparalleled performance and reliability.
Audio Transcription – Using OpenAI Whisper (medium) is an obvious choice, as the transcription output is quite accurate, and the model size is efficient for offline running. I tried the large model, but the output did not justify the increased GPU VRAM requirements.
Summarization – This aspect took the most time to refine. I initially experimented with FLAN5 and BERT models, but I found their summarization outputs to be subpar, which made the project feel unworthy. While I believe these models could perform better with extensive training, I prefer an out-of-the-box solution. Therefore, I chose Microsoft Phi 3.5 (phi3.5:3.8b-mini-instruct) as my model of choice.
Context Window – I quickly learned that a large content window-based model is best for generating great summaries. I selected Phi 3.5 due to its 128K context window.
LLM Model Quantization – My NVIDIA A4000 has 16GB of VRAM. To effectively use the Phi-3.5 model, I opted for the quantized phi3.5:3.8b-mini-instruct-q4_K_M model, which balances performance and quality output. However, I noted that the KVCache still overflows and utilizes system RAM. I also experimented with Q8 LLaMA models, but I found Q4 to be the best fit.
Because I am using the quantised model, I ended up using the Ollama container to run the GGUF model, which has the most straightforward implementation.
API/Containers – All the code utilizes FastAPI for GET/POST requests. Of course, for modularity, everything operates within a container.
Implementation Details
FastAPI for the REST Endpoints
/transcribe: Receives an audio file, calls Whisper for transcription, and returns the text.
/summarize: Takes the transcribed text, calls the LLM, and returns a summary.
Health checks (/health) keep the container orchestration informed of readiness.
Whisper
We used a GPU version for speed (if torch.cuda.is_available()).
For smaller hardware or faster inference, you can opt for "tiny" or "small" model sizes.
LLM Summarization
Could be an open-source LLM (like Llama 2, GPT-NeoX, etc.) or something hosted. We are using Microsoft Phi 3.5 (phi3.5:3.8b-mini-instruct-q4_K_M)
Direct Processing: Transcript processed in a single pass using Phi model. The biggest reason to choose a large context window is to ensure the model can process the entire transcript without truncation, chunking, overlapping sections, etc as the quality gets deteriorated with chunking
Structured Output: Summary organized into clear sections:
Overview
Main Points
Key Insights
Action Items / Decisions
Open Questions / Next Steps
Conclusions
System Prompt does all the magic for summarisation. I highly recommend spending time and learning the System Prompt
Docker
A Dockerfile that installs Python, PyTorch, Whisper, plus your LLM dependencies.
The container also runs Uvicorn for FastAPI.
If GPU acceleration is needed, we used an NVIDIA CUDA base image (e.g., nvidia/cuda:12.1.0-runtime-ubuntu22.04) and pass --gpus all to docker run.
Optional: StreamlitUI
If you want a friendly front-end, spin up a UI to upload audio, track progress, and view results in real-time.
Alternatively, you could just expose the endpoints in FastAPI and have your favorite front-end call them.
Key Challenges and Lessons
Timeouts for Large Audio
Whisper or LLM summarization might take a while for hour-long recordings.
We increased the request timeout or used asynchronous background tasks.
GPU Memory Constraints
Large LLMs and Whisper can each use significant VRAM.
Consider smaller quantized (Q2, etc.) LLMs or chunk-based summarization.
Accuracy vs. Speed
The "medium" or "large" Whisper model is more accurate but slower.
Summaries can get more coherent using bigger LLMs, but performance can suffer.
Logging & Error Handling
Detailed logs ensure you catch issues early (e.g., partial transcripts, AI inference errors).
A robust system logs whether GPU is found, load times, and inference performance metrics.
Security & Data Privacy
Audio recordings may contain sensitive information.
Ensure your container or environment has proper access controls.
Validation and Examples
Meeting Transcription + Summary
A 30-minute internal meeting is processed, producing a transcript of 6,000 words.
LLM Summaries: A concise bullet-point list of decisions, tasks, and key insights.
Podcast or Interview
Summarize multi-speaker dialogues to highlight important quotes or topics.
Possibly split each speaker’s segment, then unify in final text.
Conference Keynote
Summaries merged into an “executive summary” with top-level takeaways.
summarization.py calls your Phi3.5 LLM (Hugging Face Transformers, Ollama, etc.).
docker-compose.yml to spin up both the app container and optional GPU-based service.
Conclusion
By combining OpenAI Whisper (or any speech-to-text engine) with a Large Language Model (Phi 3.5 mini) summarizer inside a Docker container, we’ve built a unified pipeline for turning raw audio into manageable transcripts and actionable summaries. Whether you’re automating meeting minutes or analyzing podcast content, this approach saves countless hours. Feel free to experiment with chunking, smaller models, or advanced summarization prompts. Let me know how it goes!
In this blog post, we’ll embark on an exciting journey of building a comprehensive Image Analysis API using Microsoft Florence-2-large, Chainlit, and Docker. Image analysis is a fascinating field that involves extracting meaningful information from images using advanced AI techniques. By leveraging the power of Microsoft’s Florence-2-large model, we can create a system that automatically understands the content of an image and performs various analysis tasks such as captioning, object detection, expression segmentation, OCR etc..
The Microsoft Florence-2-large model is a powerful pre-trained model designed for various image analysis tasks. Developed by Microsoft, this model is part of the Florence family, which is known for its robust performance in computer vision applications. The Florence-2-large model leverages extensive training on a vast dataset of images, enabling it to excel in tasks such as image captioning, object detection, and optical character recognition (OCR).
Key Features of Florence-2-large
Multitask Capabilities: The model can perform a wide range of image analysis tasks, including generating captions, detecting objects, segmenting regions, and recognizing text within images.
High Accuracy: Trained on diverse and extensive datasets, the Florence-2-large model achieves high accuracy in understanding and analyzing image content.
Scalability: Its architecture is designed to scale effectively, making it suitable for integration into various applications and systems.
Why Florence-2-large?
We chose the Florence-2-large model for our Image Analysis API due to its versatility and performance. The model’s ability to handle multiple tasks with high precision makes it an ideal choice for building a comprehensive image analysis system. By leveraging this model, we can ensure that our API delivers accurate and reliable results across different types of image analysis tasks.
Implementation Details
To build our Image Analysis API, we started by setting up a Chainlit project and defining the necessary message handlers. The main handler accepts an image file and processes it through various analysis tasks.
We utilized the pre-trained Florence-2-large model from Hugging Face Transformers for image analysis. This powerful model has been trained on a vast dataset of images and can perform multiple tasks such as image captioning, object detection, and OCR.
To ensure a smooth development experience and ability to run on any cloud, we containerized our application using Docker. This allowed us to encapsulate all the dependencies, including Python libraries and the pre-trained model, into a portable and reproducible environment.
Choosing NVIDIA Docker Image
We specifically chose the NVIDIA CUDA-based Docker image (nvidia/cuda:11.8.0-cudnn8-devel-ubuntu20.04) for our containerization. This choice was driven by the need to leverage GPU acceleration for the Florence-2-large model, which significantly enhances the performance of image processing tasks. The CUDA-based image ensures compatibility with GPU drivers and provides pre-installed libraries necessary for efficient model execution.
chainlit_app.py: This is the heart of our Chainlit application. It defines the message handler that processes uploaded images and generates responses using the Florence model.
app/model.py: This file contains the ModelManager class, which is responsible for loading and managing the Florence-2-large model.
app/utils.py: This directory contains utility functions for image drwaing plot boxes, polygons and OCR boxes.
logging_config.py: This file contains the detailed logging of this entire project and its various files
Dockerfile: This file defines how our application is containerized, ensuring all dependencies are properly installed and the environment is consistent. The use of the NVIDIA CUDA-based Docker image ensures compatibility and performance optimization.
Task Prompts and Their Functions
Let’s break down the task prompts used in the Florence-2-large model and explain what each of them does:
<CAPTION>
Purpose: Generates a simple, concise caption for the image.
Output: A brief description of the main elements in the image.
Example: “A credit card bill with a price tag on it”
<DETAILED_CAPTION>
Purpose: Provides a more detailed description of the image.
Output: A comprehensive description including more elements and details from the image.
Example: “The image shows a credit card bill with a black background. The bill is printed on a white sheet of paper with a blue border and a blue header. The header reads ‘Credit Card Bill’ in bold black font. The bottom of the bill has a space for the customer’s name, address, and contact information.”
<OD> Object Detection
Purpose: Detects and locates objects within the image.
Output: A list of detected objects with their bounding box coordinates and labels.
Purpose: Generates an even more comprehensive description of the image than ”.
Output: A very detailed narrative of the image, often including subtle details and potential interpretations.
Example: “The image displays a credit card bill document against a stark black background. The bill itself is printed on crisp white paper, framed by a professional-looking blue border. At the top, a bold blue header prominently declares ‘Credit Card Bill’ in a large, easy-to-read font. Below this, the document is structured into clear sections, likely detailing transactions, fees, and payment information. At the bottom of the bill, there’s a designated area for customer details, including name, address, and possibly account information. The contrast between the white document and black background gives the image a formal, official appearance, emphasizing the importance of the financial information presented.”
<REFERRING_EXPRESSION_SEGMENTATION>
Purpose: Segments the image based on a textual description of a specific object or region.
Input: Requires a textual description as additional input.
Output: A segmentation mask for the described object or region.
<REGION_TO_SEGMENTATION>
Purpose: Generates a segmentation mask for a specified region in the image.
Input: Requires coordinates of the region of interest.
Output: A segmentation mask for the specified region.
<OPEN_VOCABULARY_DETECTION>
Purpose: Detects objects in the image based on user-specified categories.
Input: Can accept a list of categories to look for.
Output: Bounding boxes and labels for detected objects matching the specified categories.
<REGION_TO_CATEGORY>
Purpose: Classifies a specific region of the image into a category.
Input: Requires coordinates of the region of interest.
Output: A category label for the specified region.
<REGION_TO_DESCRIPTION>
Purpose: Generates a detailed description of a specific region in the image.
Input: Requires coordinates of the region of interest.
Output: A textual description of the contents of the specified region.
‘<OCR_WITH_REGION>’
Purpose: Performs OCR on specific regions of the image.
Output: Extracted text along with the corresponding regions (bounding boxes) where the text was found.
These task prompts allow us to leverage the Florence-2-large model’s capabilities for various image analysis tasks. By combining these prompts, we can create a comprehensive analysis of an image, from basic captioning to detailed object detection and text recognition. Understanding and effectively utilizing these task prompts was crucial in maximizing the potential of the Florence-2-large model in our project.
Lessons Learned and Debugging
Throughout the development of our Florence Image Analysis project, I encountered several challenges and learned valuable lessons:
Flash Attention Challenges: One of the most significant hurdles we faced was integrating flash-attn into our project. Initially, we encountered installation issues and compatibility problems with our CUDA setup. We learned that:
Flash-attn requires specific CUDA versions and can be sensitive to the exact configuration of the environment.
Note we moved to NVDIA based docker image to take care of all the pre-requsites specific to CUDA/Flashattention and interoperatbility of versions, that helped tremendously
Building flash-attn from source was often necessary to ensure compatibility with our specific setup. environment.
Using the --no-build-isolation flag during installation helped resolve some dependency conflicts. Solution: We ended up creating a custom build process in our Dockerfile, ensuring all dependencies were correctly installed before attempting to install flash-attn.
Segmentation and OCR with Region Iterations: Implementing effective OCR, especially with region detection, proved to be an iterative process:
Initially, we tried using the Florence model for general OCR, but found it lacking in accuracy for structured documents.
We experimented with pre-processing steps to detect distinct regions in documents (headers, body, footer) before applying OCR.
Balancing between processing speed and accuracy was a constant challenge. Solution: We implemented a custom region detection algorithm that identifies potential text blocks before applying OCR. This improved both accuracy and processing speed.
Error Handling and Logging: As the project grew more complex, we realized the importance of robust error handling and comprehensive logging:
Initially, errors in model processing would crash the entire application.
Debugging was challenging without detailed logs. Solution: We implemented try-except blocks throughout the code, added detailed logging, and created a system to gracefully handle and report errors to users.
Optimizing for Different Document Types: We found that the performance of our system varied significantly depending on the type of document being processed:
Handwritten documents required different preprocessing than printed text.
Certain document layouts (e.g., tables, multi-column text) posed unique challenges. Solution: We implemented a document type detection step and adjusted our processing pipeline based on the detected type.
Balancing Between Flexibility and Specialization: While I aimed to create a general-purpose image analysis tool, we found that specializing for certain tasks greatly improved performance:
We created separate processing paths for tasks like receipt OCR, business card analysis, and general document processing. Solution: We implemented a modular architecture that allows for easy addition of specialized processing pipelines while maintaining a common core.
These lessons significantly improved the robustness and effectiveness of our Florence Image Analysis project.
Validation of the API with real Examples
After the container is up and running, users can access the Chainlit interface at http://localhost:8010. Here’s an example of how to use the API:
Example – <Caption>
Example – <MORE_DETAILED_CAPTION>
Example – <OCR>
Example – <OCR_WITH_REGION>
Model GPU – VRAM Consumption
Reference Links
Following are the list of helpful links:
Description
Link
Florence-2: Advancing a Unified Representation for a Variety of Vision Tasks
Building this comprehensive Image Analysis API with Florence-2-large, Chainlit, and Docker has been an incredible learning experience. I must have spend atleast a week to get to this point working all the features and functionality within a Docker image. By leveraging the power of advanced AI models and containerization, we created a scalable and efficient solution for performing various image analysis tasks automatically. Through this project, we gained valuable insights into model management, error handling, GPU utilization in containerized environments, and designing interactive UIs for AI applications.
I hope that this blog post has provided you with a comprehensive overview of our Image Analysis API project and inspired you to explore the fascinating world of computer vision. Feel free to check out our GitHub repository, try out the API, and let me know if you have any questions or suggestions!.
Azure Virtual Machines (VMs) are a powerful tool for running applications, hosting desktops, and performing various tasks in the cloud. However, the cost of running VMs can add up quickly, especially if they are left running when not in use. Microsoft has introduced a new feature called VM Hibernation, which allows you to save costs by hibernating your VMs when they are not needed. In this blog post, we will explore the benefits of VM Hibernation and how you can use it to optimize your Azure costs.
What is VM Hibernation
VM Hibernation is a cost-saving feature that allows you to deallocate a VM while preserving its in-memory state. When a VM is hibernated, you don’t pay for the compute costs associated with the VM. Instead, you only pay for the storage and networking resources associated with the VM. This means you can save a significant amount of money on your Azure bill by hibernating VMs when they are not in use. Obviously this wont work on its own you will have to intergrate this further with Scaling Plans & Azure Automation.
Use Cases for VM Hibernation
Category
Description
Virtual Desktops
If you use Azure Virtual Desktop to provide virtual desktops (Personal Only) to your employees, you can use VM Hibernation to save costs during non-business hours. By hibernating the VMs after business hours and resuming them the next morning, you can avoid paying for compute resources when they are not needed.
Dev/Test Environments
If you have development or testing environments that are not used 24/7, you can use VM Hibernation to save costs. By hibernating the VMs when they are not in use, you can avoid paying for compute resources that are not needed.
Prewarmed VMs
If you have applications that have long initialization times due to memory components, you can use VM Hibernation to save costs. By bringing up the apps and hibernating the VMs, you can quickly start the “prewarmed” VMs when needed, with the applications up and running in the desired state.
How to Enable Hibernation
Enabling hibernation is straightforward and can be done using various tools like Azure Portal, PowerShell, CLI, ARM, SDKs, and APIs. etc. I will be demonstrating within the Azure Portal:
Create a Host Pool – Select Personal
Under the Host Pool creation ensure you have Personal selected as this doesn’t work for Pooled
Under Host Pools –> Virtual Machine –> Select Hibernate
To take full advantage of VM Hibernation, you can configure scaling plans for your VMs. Scaling plans allow you to automatically hibernate VMs based on a schedule or based on user activity.
Start VM on Connect – Ensure that is “Yes“
Configure Hibernation Settings
Define hibernation after a user session disconnects or logs off for a configurable period.
Assign the Scaling Plan
Apply the scaling plan to one or more personal host pools.
Reference Links
Following are the list of helpful links:
Description
Links
Hibernation support now available for Azure Virtual Desktop
VM Hibernation is a powerful cost-saving feature that can help you optimize your Azure costs. By hibernating VMs when they are not in use, you can save a significant amount of money on your Azure bill. Whether you are using VMs for virtual desktops, dev/test environments, or prewarmed VMs, VM Hibernation can help you save costs without sacrificing performance or availability. Do give it a try in your enivornment and see how much you can save?


Recent Comments